|
Dr. Douglas Oliver is a professor at the University of Connecticut Health Center as well as the Vice-Chair of the Department of Neuroscience. His research focuses on the anatomy and physiology of the central nervous system. This includes studying the numbers and types of synapses made on auditory neurons.
Dr. Oliver and his team use Origin for graphing and analyzing quantitative data:
“We chose Origin many years ago over other software because of its ease of use, intuitive organization, and ability to produce professional quality graphs…it allows us to import data from other scientific software that we use such as pCLAMP and Image-Pro. This allows us to convert raw experimental data into both analyses and finished illustrations.”
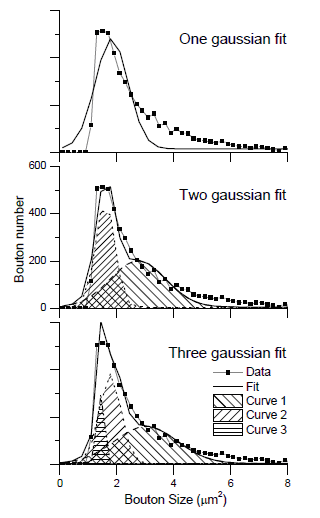
For example, they used Origin to model populations of the axonal terminals that form the synapses. In order to do so the number of terminals and the respective sizes were imported into Origin as raw measurement data from an external image processing program, Image-Pro. A frequency count was performed and used to generate a histogram, and a line graph fitted to the histogram.
| |
| Organization Department of Neuroscience
University of Connecticut Health Center
|
| Goal Model populations of axonal terminals that form synapses
|
| Solution Use Origin to fit multiple Gaussian curves on data to draw conclusions about the populations of the axonal terminals that form synapses.
| Key Features
- Import Molecular Devices pCLAMP electrophysiology data
- Import Image Processing Image-Pro data
- Frequency count to create a histogram
- Fit line to the histogram
- Peak analysis
- Publication-quality graphs
|
The team then used Origin’s Peak Analyzer dialog to fit the data with up to three Gaussian curves.
The statistics on the curves showed that the fit with three curves was not significantly better than the fit with two curves, suggesting that an appropriate model for the data was two populations of synaptic terminals; one smaller and one larger.
From: Malmierca MS, Saint Marie RL, Merchan MA & Oliver DL. (2005). Laminar inputs from dorsal cochlear nucleus and ventral cochlear nucleus to the central nucleus of the inferior colliculus: two patterns of convergence. Neuroscience 136, 883-894.
|