Visualizing the Simulation of Molecular Dynamics with Origin Graphs
Problem
Create visual representations of molecular dynamics simulations for research and publication purposes.
Solution
Use Origin to make graphs for creating presentations and publishing academic papers. Use Origin's data analysis features for supporting operations such as inserting an approximation curve into a graph, curve fitting and integration.
The following case study was submitted by Japanese Origin distributor LightStone Corporation. Lightstone has provided sales and support for the Japanese-language version of Origin, for nearly twenty years. We thank them kindly for giving permission to publish this case study on our website.
“Origin saves me time because it can create graphs repeatedly with the same format either by copy-and-applying the graph format, or by using a graph template.”
Introduction
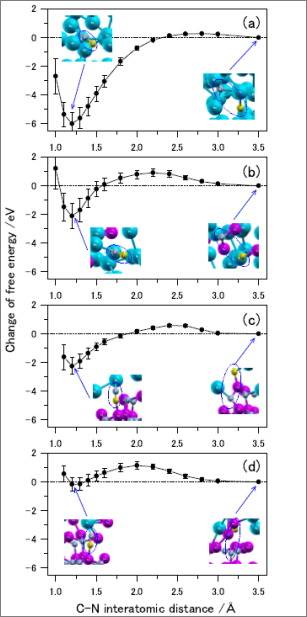
Molecular dynamics simulations are used to study atomic-level phenomena which are difficult to observe in an actual experiment. Using this technique, the team of Research Assoc. Takahiro Kawamura is studying crystal growth and crystal defects of wide-gap semiconductors and metals like TiAl alloy.
Making Suitable Graphs for Academic Papers
L (LightStone): How did you start using Origin in your work?
K (Res. Assoc. Kawamura): When I was a student, I usually used TeX to write papers, but this tool required an image file in EPS format to insert a graph into my document. To create this type of image file, I started using Origin which had been installed in my lab’s computer.
L: In which of your research activities did you most need to use Origin?
K: Needless to say, I needed Origin mainly to make graphs for publishing academic papers, or to make presentation materials for conferences. However, I also frequently use data analysis features such as inserting an approximation curve into a graph, curve fitting, integration, etc.
“It is quite easy in Origin to customize the details of a graph such as the plot’s line thickness, symbol size, and colors, as well as the dimensions of the graph page or the layer arrangement.”
L: What are your favorite features in Origin?
K: It is quite easy in Origin to customize the details of a graph such as the plot’s line thickness, symbol size, and colors, as well as the dimensions of the graph page or the layer arrangement. Also, Origin saves me time because it can create graphs repeatedly with the same format either by copy-and-applying the graph format, or by using a graph template. In addition, Origin is versatile such that the graph can be exported in a variety of image formats, a wide variety of built-in fit functions are available, etc.
As Origin evolves with a new version every year, I haven’t caught up to some new features. But, I feel confident that I can rely on the technical support from LightStone even when I encounter the difficulties with such new features.
Origin’s Visualization Power
L: Please explain us which kind of graphs you make in your actual work.
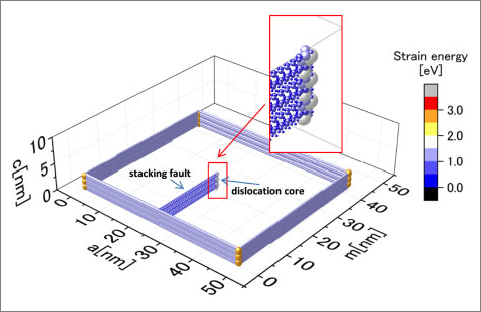
K: The following graph is a sample 3D visualization showing the deformation energy distribution around the extended dislocation in a SiC crystal. The atomic coordinates and deformation energy are correspondingly visualized, and adding annotations at the defect position makes for a nice presentation.
Advice for Origin Beginners
L: Please advise people who have just started using Origin, or who are considering using Origin in the near future.
K: As you know, Origin is a software package which can be used both for graphing and data analysis. Some people who are considering Origin just for making graphs may think that the price is a bottleneck to purchase; However, I would assure them that upon using Origin, they would recognize that this software is capable of creating a variety of really beautiful graphs such as 2D bar charts or contour plots, a variety of 3D graphs, etc. -- not just common scatter plots or line plots.
If these were the only features, it would still be worth using in your work. I know that Origin has a very affordable student version (which is a Pro version [editor]), and it is quite suitable for a student who is going to present his or her research work in a conference, or to write a research paper.
“Origin has a very affordable student version and it is quite suitable for a student who is going to present his or her research work in a conference, or to write a research paper.”
L: L: Thank you very much for sharing your important work with us. We look forward to continuing to serve you with future versions of Origin.