Origin in Diabetes Research at the
Pacific Northwest Diabetes Research Institute
Origin in Diabetes Research
Problem
Developing application-specific non-linear models and preparing figures for publication in various journals.
Solution
- Use the nonlinear fitter to estimate model parameters
- Use the Layout Page to combine elements into a single publication-ready graphic
- Use Origin's OLE capability to perform in-place editing of figures in MS Word manuscripts
- Export final figures to TIF or EPS for publication
"I can usually accomplish what I want to do faster in Origin and rely on it."
The Pacific Northwest Diabetes Research Institute (PNDRI) is a non-profit biomedical research center located in Seattle, Washington. Founded in 1956, the Institute employs a large staff dedicated to studying and developing treatments for all forms of diabetes. The Institute's website notes that while each Principal Scientist focuses on a particular area of research, "collectively, the complementary programs create a comprehensive body of knowledge that significantly advances global understanding of all types of diabetes and perhaps one day lead to cures."
Joseph Bryan Ph.D. is a Principal Scientist at PNDRI. His research has focused on the ionic mechanisms that underlie insulin secretion by pancreatic beta-cells in response to changes in blood sugar levels, particularly with respect to the role that ATP-sensitive K+ channels (KATP) play in the process. Genetic mutations that lead to a loss or gain of channel activity are linked to congenital hyperinsulinism (too much insulin secretion) and neonatal diabetes (too little insulin secretion).
Dr. Bryan tells us that he has used a lot of scientific graphics packages but he has stayed with Origin because he is comfortable with it, and because it best fits his need for presenting the electrophysiological and pharmacological data collected while conducting his diabetes research.
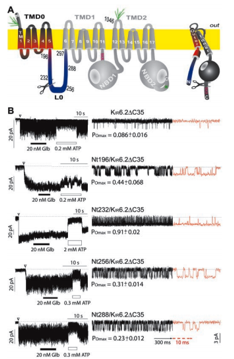
This graphic was composed using Origin's Layout Window feature. Layout Windows allow you to combine graphs, tables and image files into a single graphic for export to the Clipboard or to any of various raster or vector image files.
FIGURE: Generation of mini-KATP channels from THE JOURNAL OF BIOLOGICAL CHEMISTRY 278, 41577–41580, 2003. .
"Origin provides a convenient, highly flexible platform for data analysis as well as generation of high quality figures for publication and presentation."
Dr. Bryan’s research group has used Origin for more than a dozen years. He notes that “it is particularly efficient to be able to set up and reuse a template for a particular style of graph where the font sizes, axes offsets, log vs. linear scales, axes labels, etc. are customized.”
“We have used Origin to plot reasonably large electrophysiologic data sets generated using pClamp. Combining individual graphics with multi-panel graphs using Origin’s Layout window, is reasonably efficient and the layouts can be exported to various graphics formats for publication.”
Bryan’s group typically prepares their manuscripts in MS Word and they use Origin’s Copy Page feature to embed graphs and subsequently make adjustments to them via Object Linking and Embedding (OLE). “This requires formatting and reformatting text and figures to get the font sizes, etc. exactly the way a journal wants it with figures at such and such DPI in a TIF or EPS format. This is all very journal-specific. It is very useful to be able to double-click a figure, fine tune symbol size, color, line widths, etc. It is - shall I say "delightful" - not to have to go back, locate the original Origin files and modify them, but rather simply to save files with names like Fig 1, Fig 2, etc., then just export the TIF files for submission.”
The group also frequently makes use of Origin’s non-linear curve fitting tool to estimate model parameters and they have developed several application-specific fitting routines to analyze data from particular experiments. “The ease with which this can be accomplished makes it feasible to test multiple models efficiently.”
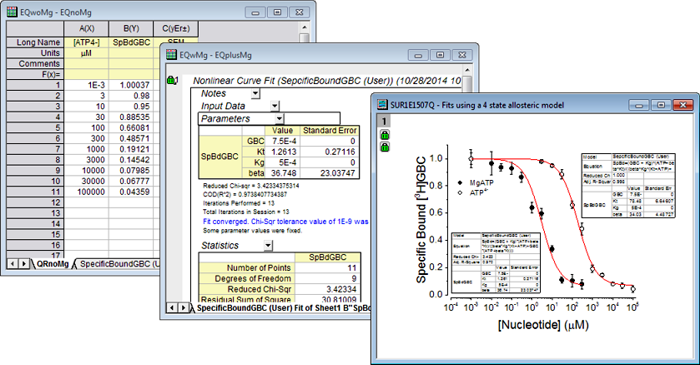
Modeling the effect of MgATP and ATP4- on [3H]GBC binding to SUR1E1507Q
We asked Dr. Bryan to tell us about a recent research project that involved using Origin:
"We recently published an analysis of mice engineered to lack KATP channels selectively in glucagon secreting alpha-cells that are found in the same pancreatic “islets” alongside beta cells. The “cre-lox knockout” technology employed to selectively target a gene in a specific cell type is usually considered to be highly efficient and we obviously wanted to eliminate these channels in all alpha-cells. To our surprise the efficiency of channel knockout, which requires eliminating both copies of the SUR1/ABCC8 gene that encodes the channel regulatory subunit, was modest; the data fit best with a model where knockout was stochastic with a frequency of about 0.7 per copy."
The results of this study are published in the online journal PLOS ONE.

Stimulation of isolated pancreatic islet cells by arginine.
(A) α- and β-cells were distinguished by their response to an epinephrine pulse in 2.8 mM glucose. (B) Arginine stimulation was blocked by nifedipine (10 μM). The solid traces and shaded areas are the means ± SEM, respectively, for the indicated number of cells. These experiments were repeated four times with similar results using different islet preparations derived from 1 or 2 mice. (C and D) Responses of WT and Sur1−/− α- and β-cells to increasing concentrations of arginine at three concentrations of glucose. Each trace is an average of Ca2+ values from 4–10 cells; the experiments were repeated 4 times with similar results using different islet preparations. Islet preparations were from 1 or 2 mice. The pulse lengths are 5 minutes. The 5.6 and 16.7 mM glucose α-cell traces are offset 0.1 and 0.2 units respectively, for clarity.
doi:10.1371/journal.pone.0091525.g002.

Effect of diazoxide on arginine stimulation of α-cells in WT versus Sur1−/− α-cells.
The cells were in 2.8± SEM, respectively, for the indicated number of cells. The experiments were repeated four times with similar results using different islet cell preparations obtained from 1 or 2 mice. The pulse lengths are 5 minutes.
doi:10.1371/journal.pone.0091525.g003.

Analysis of Sur1loxP/loxP;GCG-cre+ islet cells.
(A) α-Cells in 2.8 mM glucose were pulsed for five minutes with arginine (1 mM) or arginine plus diazoxide (100 μM) as indicated. In this experiment diazoxide had no effect in four cells (gray traces), while in two cells (black traces) the channel agonist blocked stimulation by arginine. All six cells were stimulated by epinephrine (5 μM). (B) In a separate experiment β-cells were stimulated with 16.7 mM glucose and pulsed for five minutes with diazoxide (100 μM). The individual traces show [Ca2+]c was reduced to baseline values in all of the β-cells. The upper trace, offset by 0.3 units, shows the mean ± SEM values (n = 20).
doi:10.1371/journal.pone.0091525.g004.