|
Dr. Mark Kuzyk, Regents Professor of Physics and Astronomy at Washington State University and his team use Origin and Origin C++ extensively for both theoretical work and to analyze experimental data. For their theoretical work, they use Origin to run Monte Carlo calculations and plot the data in ways that allow them to visualize patterns and draw conclusions based on those patterns. The group works on the process of reversible photo-degradation of certain dyes. They explore the processes which cause the samples to recover their original color in the dark after being exposed to bleaching light. Since their experiments run non-stop and generate vast amounts of data, Origin’s automated data import features save considerable time.
The parameters in modeling these dye recovery processes include the change in spectra: absorbance spectra and fluorescence spectra, and intensity of ASE (Amplified Spontaneous Emission) during decay and recovery. The graduate students use Visual Basic DLLs and Origin to create and use custom, multi-dimensional integral fitting functions with several parameters and variables. They can also easily modify the models as the analysis procedure evolves.
Figures 1 and 2 show graphs depicting an optical property Beta. The Beta for a molecule is plotted against Sigma which is the amount by which the sum rules are violated. The value of sigma signifies how many states need to included in the calculation; the larger the sigma, the more states are required. The symbol size (x) for Figure 1 is a parameter that indicates how strongly the molecule converts light to other colors while for Figure 2 the symbol size is dictated by parameter E - the energy difference in the spectrum.
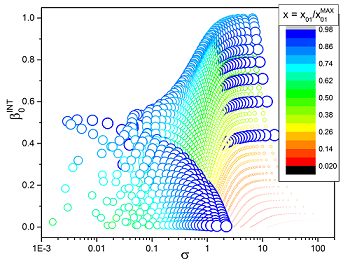
Figure 1. Optical property Beta (Y axis) as a function of sigma (X axis) for the parameter x - how much strongly a molecule converts light to other colors.
Graphs such as these show that the optical property beta can be large when the sum rules are obeyed (when sigma is low), and the magnitude of parameters such as x and E that result in large beta. The goal of the research is to control such parameters to get desired beta levels and create the most efficient materials.
| |
Dr. Kuzyk set up one undergraduate student with Origin in his senior year. The same student was able to became an expert in the language Origin C within 12 months and used it to complete a paper that was published in Physical Review A.
As a beginner with both Origin and C++, another graduate student, Shengting Hung, found that:
“Origin provides many useful online videos for basic analysis features. The syntax and examples of LabTalk and Origin C can also be found in the "help" or online documentation or Origin forums. If I still cannot figure out how to make it work, I leave my questions in the Origin forum, and here is what I really like and appreciate about Origin: Origin technical support responds to questions very quickly and in a friendly manner!”
1.png)
Figure 2. Optical property Beta (Y axis) as a function of sigma (X axis) for the parameter E - energy difference in the spectrum.
|