This app lets you interactively create a wide range of grouped-data graphs by flexibly assigning columns through simple drag-and-drop.
Installation
Download the file Graph Maker.opx, and then drag-and-drop onto the Origin workspace. An icon will appear in the Apps Gallery window.
Features
-
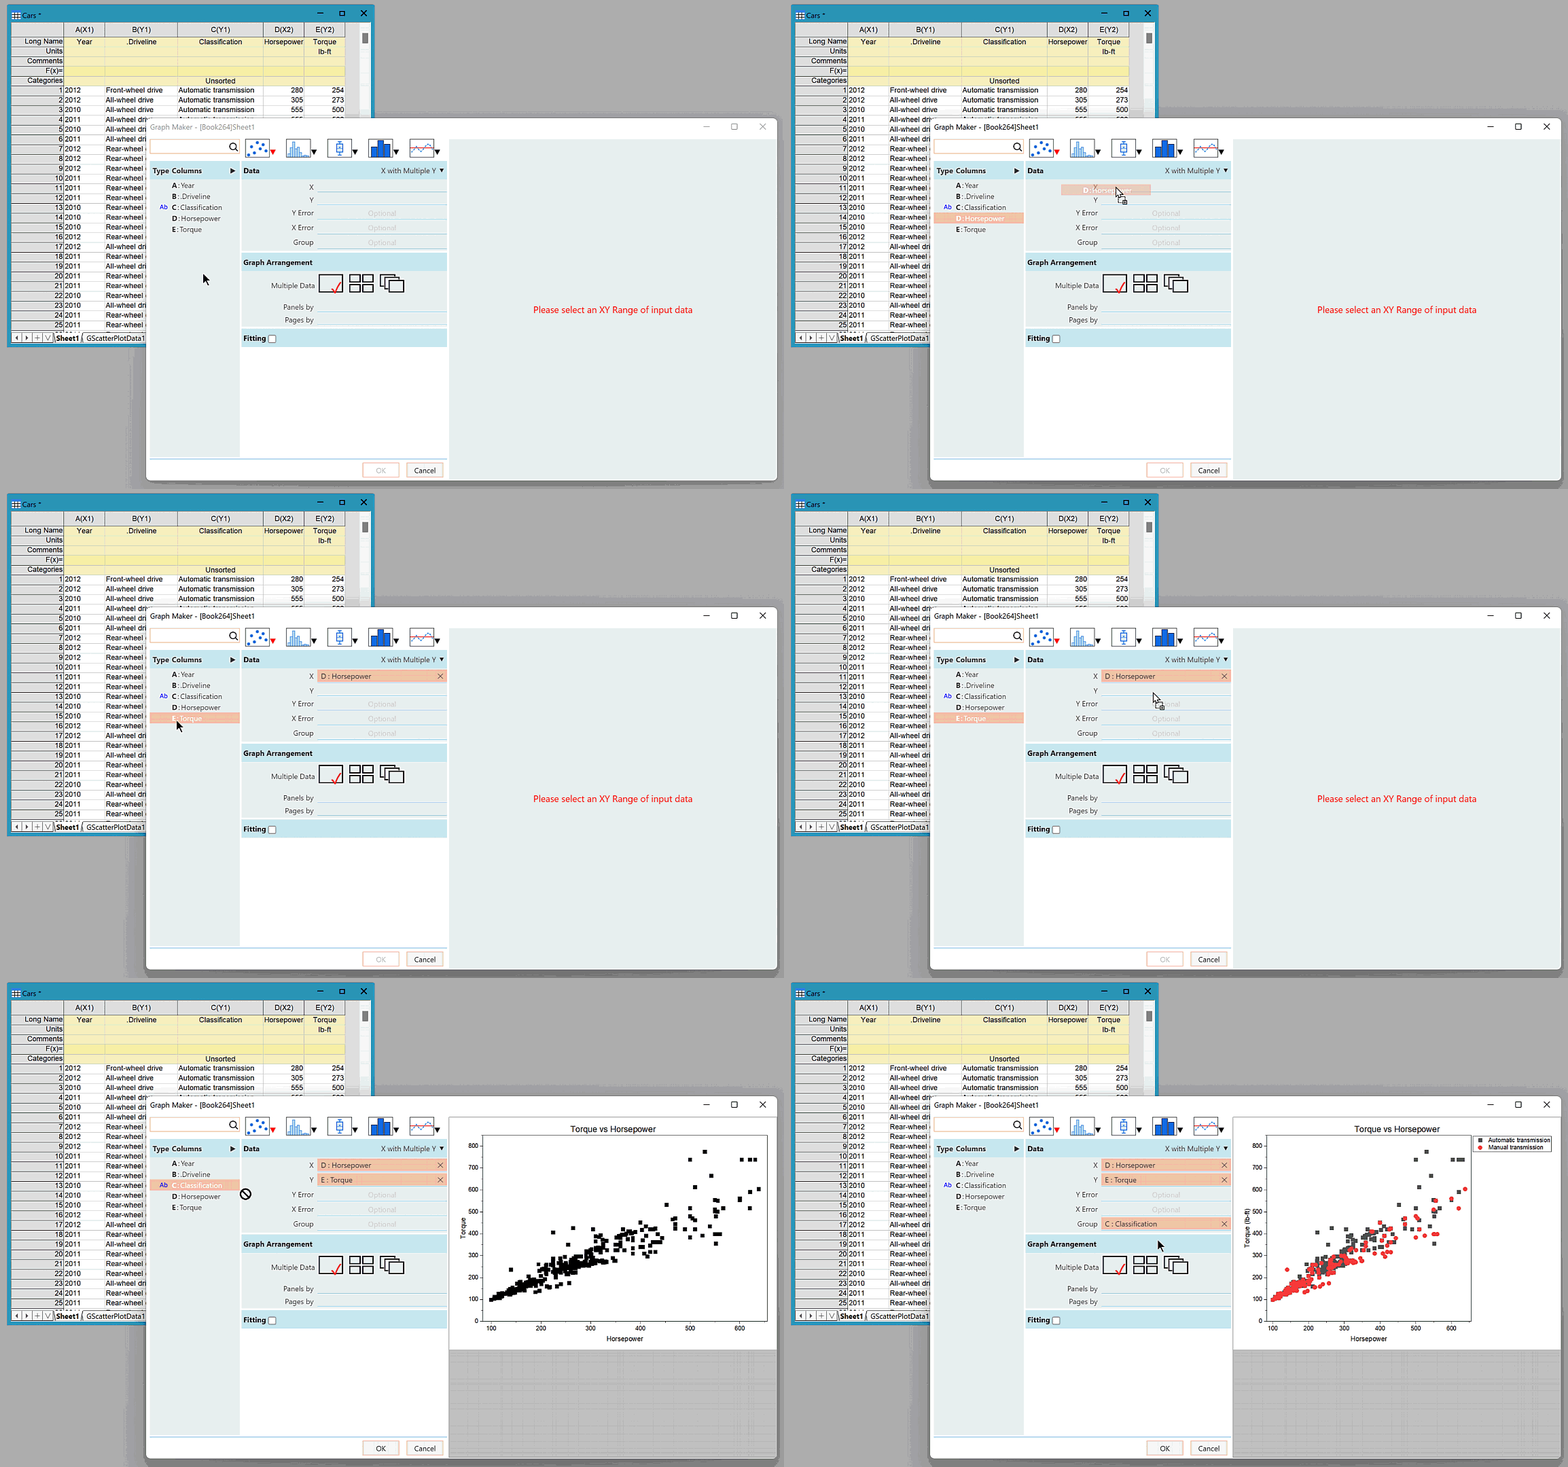
Drag and drop columns to set up the graph.
-
Switch between graph types with live preview.
-
Perform linear or polynomial fitting for scatter plots.
-
Support multiple datasets and grouping for statistical graphs.
-
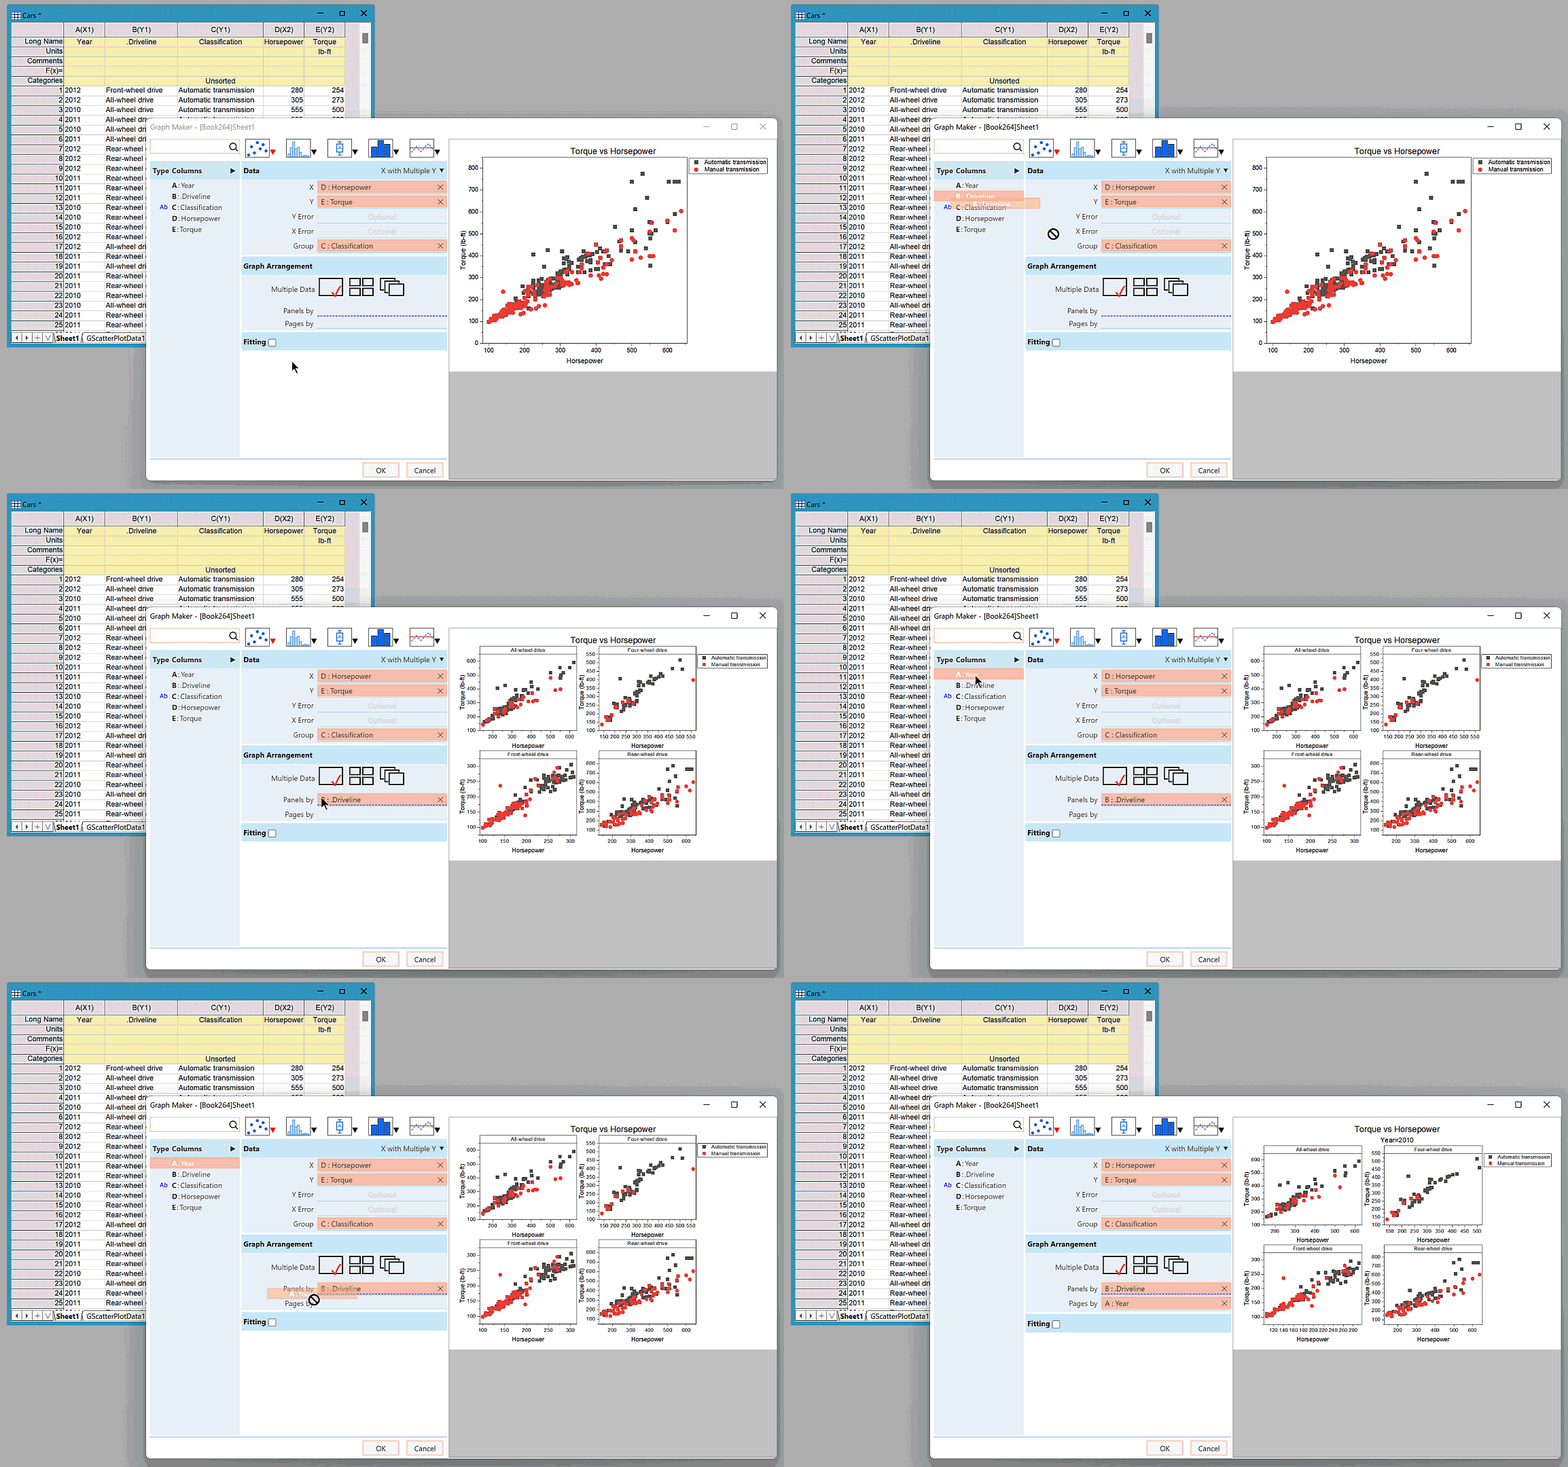
Split graphs into multiple panels on a single page and/or across multiple pages.
-
Modify data without closing the dialog—changes are automatically updated when the window is reactivated.
-
Save graph settings and reload them anytime.
-
Automatically position graph legends.
-
Search and filter worksheet columns easily.
Basic Usage
- Rich Selection of Statistical Graphs to Get You Started
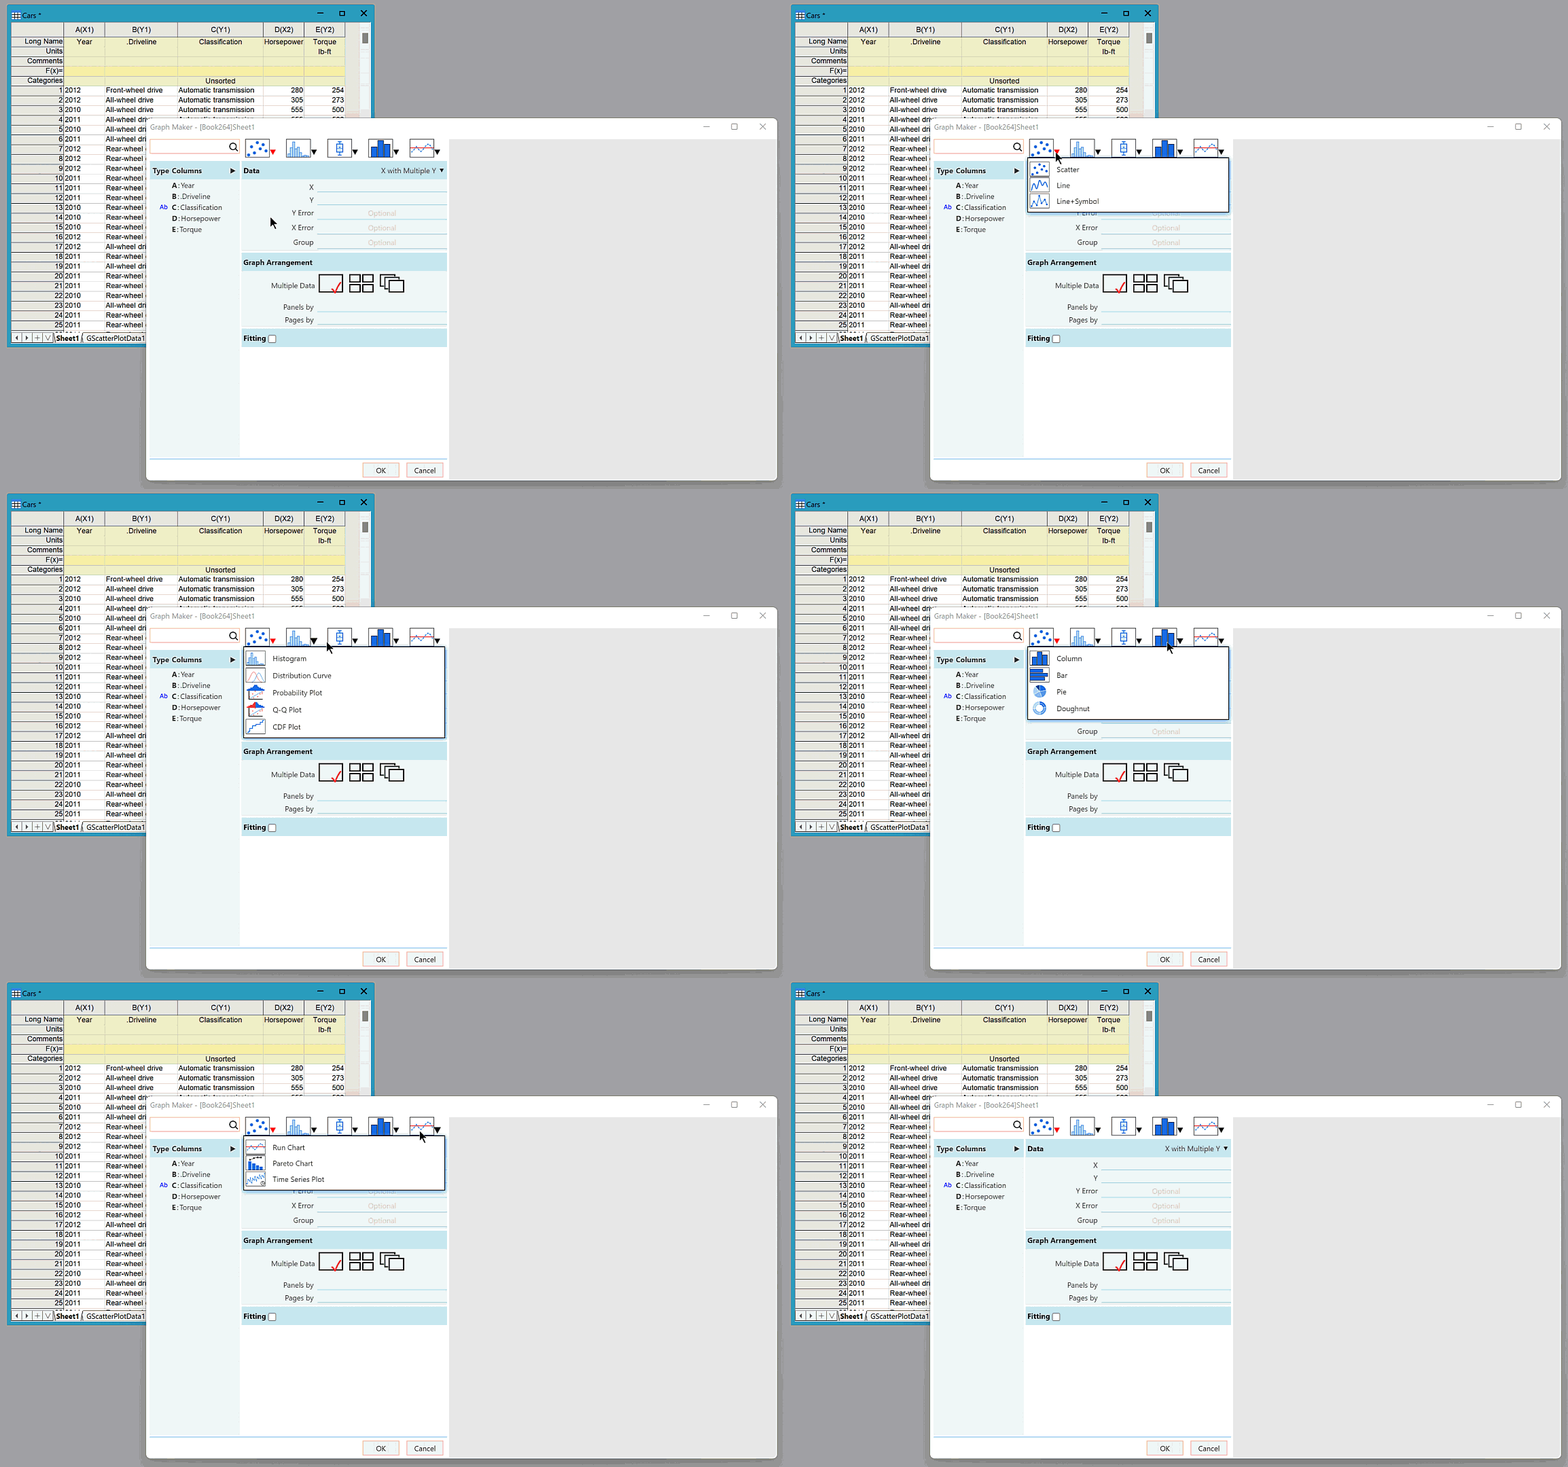
When you open the Graph Maker dialog, you’ll find several general templates that help you quickly create graphs from your data. Begin by selecting the graph type you want.

- Easily Identify and Select Your Data Columns
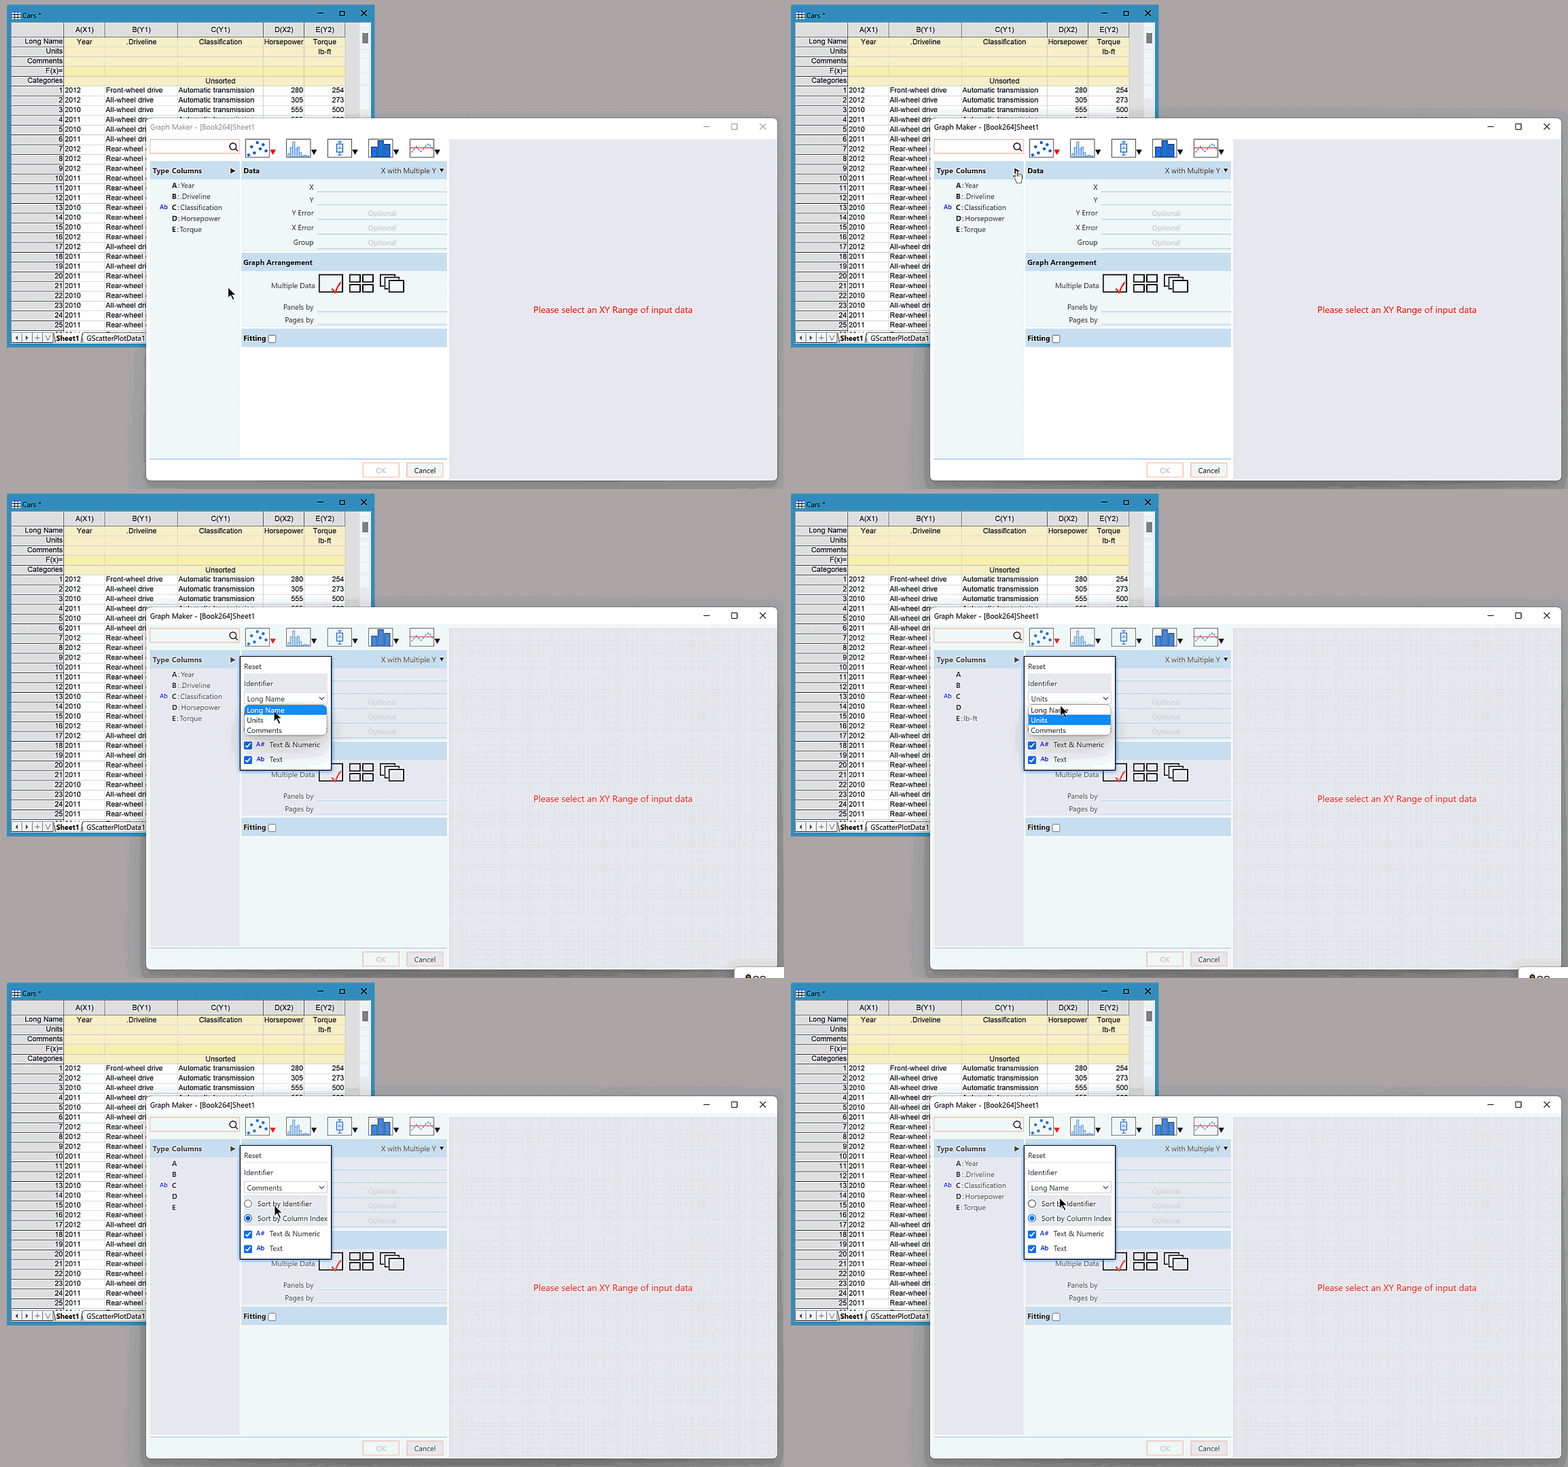
The app lists all worksheet columns by their short names along with an identifier, which by default is the corresponding long name. You can change this identifier to Units, Comments, or Parameters/User-Defined Labels (if available). Columns can also be sorted by name or index and filtered by format.

- Drag and Drop to Build Your Graph
Simply drag and drop columns into the corresponding areas, and the preview updates instantly as you assign or modify data. Multiple datasets and grouping are supported for statistical graphs.

- Quickly Split Graphs into Panels and Pages
Assign categorical columns to divide the graph into panels or pages on a single page or across multiple pages.

- Flexible Linear and Polynomial Fitting Options
Fitting is available for certain plot types. When enabled, you can easily customize the graph to display confidence or prediction bands, as well as show the fitting results directly on the graph.
.gif)
- Generate an All-in-One Report
You can export all generated graphs together into a clean and well-organized report, so you can review everything in one place without switching between windows.
.gif)