PURPOSE
This app can fit input data with all possible multiple linear regression models, compare these models, and find optimal subsets of independent variables for different statistics criteria.
INSTALLATION
Download the file Best_Subset_Selection.opx, and then drag-and-drop onto the Origin workspace. An icon will appear in the Apps Gallery window.
NOTE: This tool requires OriginPro.
REQUIRE PACKAGES
This app requires orgutils app.
OPERATION
Make a worksheet for input data active. Click on the Best Subset Selection icon in the Apps Gallery window. A dialog will open. Dialog settings include:
| Input |
Description |
| Dependent Variable |
Specify dependent variable for regression. |
Independent
Variables |
Free Independent Variables |
Specifiy possible independent variables for regression, which will be used as subsets of regression models. The maximum number of variables is 28. |
Independent Variables
in All Models |
Specify independent variables, which will be included in all regression models. It is also called Forced Variables. |
| Settings |
Description |
Number of Free
Independent Variables |
Minimum |
Only compare and show models whose number of free independent variables is no less than the Minimum value. |
| Maximum |
Only compare and show models whose number of free independent variables is no more than the Maximum value. |
| Number of Models to Show for Each Size |
Specify maximum number of models to show for each given number of independent variables. It will choose models which have the highest \(R^2\) values for each given number of independent variables. |
| Include Intercept |
Determine whether to include intercept in all regression models. |
| Output |
Description |
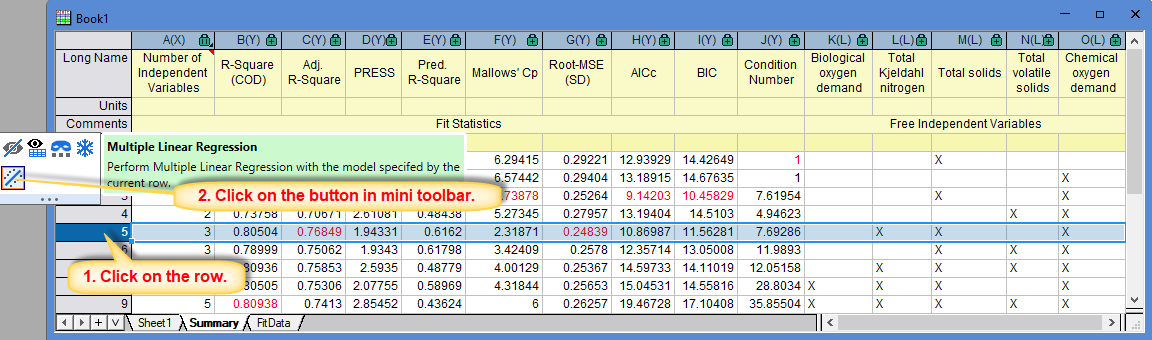
| Summary |
Report sheet to show statistics results for regression models, and list chosen free independent variables in these models. Each row in the report sheet represents a model. In each column for statistics results, the best model is marked in a red color. |
| Fit Data |
Report data to list dependent variable, free independent variables and forced independent variables. Missing values are removed. |
- Mini Toolbar
Right click on a row in the report sheet. A mini toolbar will appear. Click on Multiple Linear Regression button in the toolbar, it will perform multiple linear regression with the model specified by the row, and generate a multiple linear regression report.
SAMPLE OPJU FILE
This app provides a sample OPJU file. Right click on the Best Subset Selection icon in the Apps Gallery window, and choose Show Samples Folder from the short-cut menu. A folder will open. Drag-and-drop the project file BestSubsetEx.opju from the folder onto Origin. The Notes window in the project shows detailed steps.
Note: If you wish to save the OPJU after changing, it is recommended that you save to a different folder location (e.g. User Files Folder).
ALGORITHM
R-Square (COD), Adj. R-Square, Root-MSE (SD) are defined in the same way as Origin's built-in Multiple Linear Regression tool.
- PRESS
\(\text{PRESS} = \sum \left( \frac{e_i}{1 - h_i} \right)^2\)
where \(e_i\) is the residual, \(h_i\) in the ith diagonal element of \(X(X'X)^{-1}X'\). The smaller the value is, the better the model is.
- Pred. R-Square
\(\text{Pred}.\ R^2 = 1 - \frac{ \text{PRESS} }{ TSS }\)
where \(TSS = \sum (y_i - \bar{y})^2\), \(y_i\) is input data for the dependent variable, and \(\bar{y}\) is the mean of the dependent variable. The smaller the value is, the better the model is.
- Mallows' Cp
\(C_p = \displaystyle \frac{RSS}{\hat{\sigma}^2} - (n-2p)\)
where n is the number of input data, p is the number of parameters in the model, \(RSS = \sum e_i^2\), and \(\hat{\sigma}^2\) is Reduced Chi-Sqr for the full model. If \(C_p\) is close to p (excluding the full model because its \(C_p\) is always p. ), it will show the model is good.
- AICc (Akaike's Corrected Information Criterion)
\(\text{AICc} = -2 \ln (\text{Likelihood}) + 2(p+1) + \displaystyle \frac{2(p+1)(p+2)}{n-p-2}\)
where \(-2 \ln (\text{Likelihood}) = n \ln (RSS/n) + n + n \ln(2 \pi)\). And the smaller the value is, the better the model is.
- BIC (Bayesian Information Criterion)
\(\text{BIC} = -2 \ln (\text{Likelihood}) + (p+1) \ln (n)\)
And the smaller the value is, the better the model is.
- Condition number
\(C = \displaystyle \frac{\lambda_{\max}}{\lambda_{\min}}\)
where \(\lambda\) are eigenvalues from the correlation matrix of independent variables in the model. And the smaller the value is, the better the model is.
Reference
- nag_all_regsn (g02eac)
Related Apps
- General Linear Regression