3.9.12 Legend Substitution NotationLegend-Substitution-Notation
Origin Graph Legends
There are four standard legends for Origin graphs:
- Data Plot Legend: The default legend for most 2D and 3D graphs combines a plot symbol with legend text derived from column metadata (e.g. column Long Name).
- Categorical Values Legend: Legend entries combine a plot symbol -- one for each category within a column of worksheet data -- with the text that names the category. Categorical legends can depict multiple categorical variables (multiple columns of categorical data), with symbol variations listed by categorical variable.
- Box Chart Components Legend: Legend entries typically combine a plot symbol with a column metadata or category label, plus a symbolic list of displayed statistics.
- Point-by-Point Legend: A legend that combines a plot symbol with a number (the number can be a plot index number or a data value). Since every data point generates a legend entry, this legend type is most suited to certain plot types (e.g. Piper Diagrams) and small datasets.
The following information is presented to help you understand the variable syntax behind the various legends and, when necessary, to help you to modify legend object content.
Data Plot Legend (most 2D and 3D graphs)
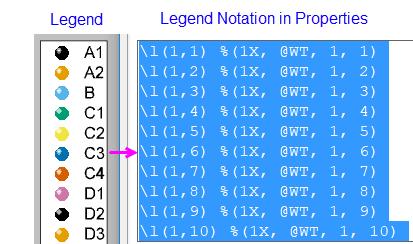
For most 2D and 3D graphs, the legend is constructed using the following substitution syntax:
Plot Symbol Component: \L([LayerIndex.]PlotIndex[,PointIndex[,option]])
Text Component: %(LayerIndex.PlotIndex[Axis, @option])
This can be seen in the user interface when you right-click on a selected legend object and choose Properties:
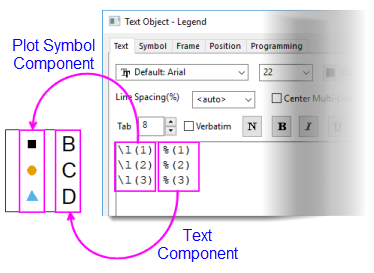
Two things to note:
- The symbol component is enclosed by \L() and the text component is enclosed by %().
- Square brackets in the syntax model merely indicate an optional argument; you do not need to type the square bracket.
Plot Symbol Component
This notation is used to construct the legend's data plot symbol, by displaying the symbol of the specified data plot. LayerIndex is optional but if omitted, the active layer is assumed. Additionally, the optional PointIndex is used to display the symbol assigned to a special data point.
Basic Syntax:
\L([LayerIndex.]PlotIndex[,PointIndex[,Option]])
where...
- LayerIndex(optional): The layer of the specified data plot, indexed from 1. For the active layer, this option can be omitted, as in \L(PlotIndex).
- PlotIndex: The data plot's position (indexed from 1) in the data list at the bottom of the Data menu or in Layer Contents. Note: this list is for all plots in the active graph layer.
- PointIndex(optional): If a single point in a dataplot has been customized, this option is used to display the single point's symbol.
- Option: Normally, the plot symbol is the representation of 1st point of the the specified data plot in specified layer(e.g. a scatter symbol) or is a representation of the data plot (e.g. line for line graph) and is generated. Or if PointIndex is specified, then it's the representation of the specified point. However, the legend data plot symbol can be customized to display independently of the data plot, as shown in the following Examples. If needed, a plot symbol can be generated that is completely independent of graph window data plots (symbol, line + symbol, and line types). See this section for details.
Legend of Partial Property of Symbol
| Legend Entry
|
Description
|
Example
|
| \l(1) %(1)
|
Original line+symbol plot
|

|
| \l(1, style:s) %(1)
|
Show symbol only for a line + symbol plot
|

|
| \l(1, style:l) %(1)
|
Show line only for a line + symbol plot
|

|
| \l(1, style:sls)
|
Show legend as symbol - line- symbol for a line + symbol plot
|

|
Legend of Scaled Symbols
| Legend Entry
|
Description
|
Example
|
| \l(1) %(1)
|
Original line+symbol plot
|
|
| \l(1, size:5) %(1)
|
Show symbol size 5
|

|
| \l(1, size:p150) %(1)
|
Scale symbol size as 150% of original symbol size
|

|
| \l(1, LineWidth:3) %(1)
|
Show line width as 3
|

|
| \l(1, LineWidth:p1000) %(1)
|
Show line width as 1000% of original line width
|

|
| \l(1, Length:p50) %(1)
|
Show line length as 50% of original length
|

|
| \l(1) %(1)
|
Original column plot
|

|
| \l(1, PatternHeight:p50) %(1)
|
Show bar height as 50% of original height
|

|
| \l(1, PatternWidth:p50) %(1)
|
Show bar width as 50% of original width
|

|
Legend of Bar Elements
| Legend Entry
|
Description
|
Example
|
| \l(1) Bar
|
Original bar plot (1st bar of 1st layer)
|

|
| \l(1, style:C) Fill Color
|
Show fill color of Bar
|

|
| \l(1, 1, 2) Fill Color
|
Show fill color of the 1st bar of 1st layer in a block
|

|
| \l(1, style:P) Pattern
|
Show Pattern Style of Bar
|

|
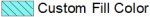
| \l(1, style:P#81F7F3) Custom Fill Color
|
Show legend of fill with custom color
|
|
| \l(1, 1, 1) Border Color
|
Show border color of the 1st bar of 1st layer in a block
|

|
| \l(1, 1, 3) Pattern Color
|
Show pattern color of the 1st bar of 1st layer in a block
|

|
 | It is possible to add symbol, line + symbol and line-type plot symbols that are not associated with any plot in the layer, to the legend. For information on this, see Adding Symbols Not Used in Plots.
|
Text Component
Legend text can be created using literal text (manually) but the more usual and efficient method relies on substitution notation -- use of LabTalk variables to display metadata associated with the dataplot. These metadata can be accessed by specifying an "@" option and can be used to override default legend construction behavior specified in the Legends/Titles tab in the graph's Plot Details dialog box. As previously mentioned, square brackets denote optional arguments and are not typed when constructing the legend text.
Basic Syntax
%([LayerIndex.]PlotIndex[Axis[, @option]])
where...
- LayerIndex(optional): The layer of the specified data plot, indexed from 1. For the active layer, this option can be omitted, as in \L(PlotIndex).
- PlotIndex: The data plot's position (indexed from 1) in the data list at the bottom of the Data menu or in Layer Contents. Note: this list is for all plots in the active graph layer.
- Axis: For the specified layer and plot, X, Y or Z, indicates which column of the source data will be referred to. If not specified (default), it is assumed to be Y for 2D graphs, and Z for 3D graphs.
- @option: This option can be used to override the default Auto Legend Translation Mode that is saved with the graph template. See the Legend Text Customization section of this page for a list of @options related to graph legends.
Examples
| Legend Entry
|
Description
|
|
\l(1) %(1)
\l(2) %(2)
|
Both lines are the legends for the data plots in the active layer. The first line is for the first plot, and the second line for the second plot.
Based on the typical default specified in the Legends/Titles tab in the Plot Details dialog of the graph, the legend's label will look for Comments in the source data worksheet, if no Comments then Long Name will be used, and if no Long Name, Short Name is used.
|
|
\l(1.1) %(1.1)
\l(2.1) %(2.1)
|
The first line is the legend for the first plot in the first layer, and the second line for the first plot in the second layer.
|
|
\l(1) %(1, @LD1)
\l(1) %(1Y, @LD1)
\l(1) %(1, @LD"UserP Name")
|
The legend symbol is from the first plot in the active layer, and the legend's label is from the first User Parameter row of the Y column in the source data worksheet. Identical for 2D plots since Y is optional. Note that you can refer to parameter by user-parameter row number or name (if spaces, contain in double-quotes).
|
|
\l(1) %(1X, @L)
|
The legend symbol is from the first plot in the active layer, and the legend's label is from the Long Name of the X column in the source data worksheet.
|
|
\l(2.3, 5) %(2.3X, @LU) Lowest Value
|
The legend symbol is from the fifth point in third plot in the second layer, and the legend's label is from the Units of the X column in the source data worksheet plus additional user-supplied text: Lowest Value.
|
|
\l(1, 3, 2) %(1)
|
The legend symbol is from the 3rd symbol in the active layer, and the plot element used is the interior color.
|
Notes:
- Any text object can contain this syntax and act like a legend provided the Link to (%, $) Substitution Level on the object properties Programming tab is set to 1.
- The active layer for any legend object is the layer to which the object is attached.
- Only one object named Legend can exist in any one layer.
Categorical Values Legend
In Origin, each text "value" in a categorical dataset is mapped to an index value, starting from 1, to allow for plotting and analysis operations. Since this index value controls such things as plotting order, you can order your categorical values in any way that suits you.
As with the standard Data Plot Legend, Origin employs a special syntax to control how plot symbols and text are displayed in the Categorical Values Legend. Graphs must meet certain requirements in order to support this specialized legend type. Refer to the plot requirements for details.
Plot Symbol Component: \L(PlotIndex[.DataPoint], mCategoryIndex, PlotElement)
Text Component: %(PlotIndex, mCategoryIndex, PlotElement)
One thing to note:
- The syntax is similar to the standard legend but includes a literal m in the second argument for both the plot symbol and text components.
Plot Symbol and Text Components
Basic Syntax
\L(PlotIndex[.DataPoint], mCategoryIndex, PlotElement) %(PlotIndex, mCategoryIndex, PlotElement)
where...
- PlotIndex: An integer which indicates plot order (seen in Plot Details or the Data list).
- DataPoint: An integer which is the data point row index.
- CategoryIndex: The index number for a particular categorical value (determined by column Sort status).
- PlotElement: An integer representing the plot element that is indexed to the categories within a dataset. The parameter can take values of 1 to 14, where 1=edge color, 2=fill color, 3=pattern color, 4=symbol shape, 5=symbol interior, 6=symbol size, 7=line style, 8=fill pattern, 9=box chart connect lines, 10=vector color, 11=vector style, 12=line style, 13=line width, 14=violin plot fill color. With the exception of pattern color (defined in the Pattern tab), all plot elements are controlled in the Symbol tab of the plot. All values may not be valid for a particular plot style. When this is the case, an invalid entry will be indicated by a red x in a red box or a hollow black square.
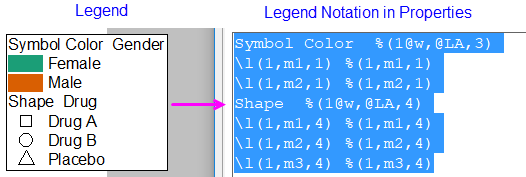
Each plot element generates a legend entry that combines the plot element with a dataset identifier derived from column metadata. In the above example, for PlotElement = Symbol Color (edge color), that identifier is "Gender". This identifier is determined by the "@option" chosen from the list below. The remainder of the notation that generates the text "Gender" merely identifies the book and column used in indexing PlotElement and is not intended to be modified.
Examples:
| Legend Entry
|
Description
|
Edge Color %(Book, @option, ColumnIndex)
\l(1, m1, 1) %(1, m1, 1)
\l(1, m2, 1) %(1, m2, 1)
\l(1, m3, 1) %(1, m3, 1)
|
The edge color of the symbol is controlled by a categorical dataset.
|
Color %(Book, @option, ColumnIndex)
\l(1,m1,1) %(1,m1,1)
\l(1,m2,1) %(1,m2,1)
|
The symbol color is controlled by a categorical dataset.
|
Fill Color %(Book, @option, ColumnIndex)
\l(1, m1, 2) %(1, m1, 2)
\l(1, m2, 2) %(1, m2, 2)
\l(1, m3, 2) %(1, m3, 2)
|
The fill color of the symbol is controlled by a categorical dataset.
|
Fill Pattern %(Book, @option, ColumnIndex)
\l(1,m1,8 1 2 3) %(1,m1,8)
\l(1,m2,8 1 2 3) %(1,m2,8)
\l(1,m3,8 1 2 3) %(1,m3,8)
|
The fill pattern is controlled by a categorical dataset.
|
Pattern Color %(Book, @option, ColumnIndex)
\l(1,m1,3) %(1,m1,3)
\l(1,m2,3) %(1,m2,3)
|
The pattern color is controlled by a categorical dataset.
|
Shape %(Book, @option, ColumnIndex)
\l(1, m1, 4) %(1, m1, 4)
\l(1, m2, 4) %(1, m2, 4)
\l(1, m3, 4) %(1, m3, 4)
|
The symbol shape is controlled by a categorical dataset (2D Symbol Only).
|
Interior %(Book, @option, ColumnIndex)
\l(1, m1, 5) %(1, m1, 5)
\l(1, m2, 5) %(1, m2, 5)
\l(1, m3, 5) %(1, m3, 5)
\l(1, m4, 5) %(1, m4, 5)
|
The symbol interior is controlled by a categorical dataset. (2D Symbol Only)
|
Size %(Book, @option, ColumnIndex)
\l(1, m1, 6) %(1, m1, 6)
\l(1, m2, 6) %(1, m2, 6)
|
The symbol size is controlled by a categorical dataset.
|
The Box Chart Components Legend
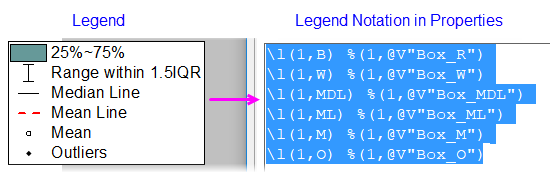
Like other legend types, the legend for box chart components is comprised of a symbol component and a text component. However, the syntax is unique to the box chart legend.
Plot Symbol Component
\L(PlotIndex,ComponentChar)
Text Component
%(PlotIndex, @V"Box_ComponentChar")
Values of ComponentChar
- PlotIndex: An integer which defines the data plot number.
- ComponentChar: One or more characters to define a component of the box chart. Note how in Text Substitution, the characters are preceded with Box_ and enclosed in double quotes.
| Character(s)
|
Description (Substituted Text)
|
Example
|
| B
|
The box. This character is only used for plot symbol component.
|
\L(1,B) ----------
|
| R
|
The box range (e.g. 25%~75%). This character is only used for the text component.
|
---------- %(1, @V"Box_R")
|
| W
|
The whisker of box. (e.g. Outlier)
|
\L(1,W) %(1,@V"Box_W")
|
| MDL
|
The median line of the box. (Median Line)
|
\L(1,MDL) %(1,@V"Box_MDL")
|
| ML
|
The mean line of the box. (Mean Line)
|
\L(1,ML) %(1,@V"Box_ML")
|
| Max
|
The max percentile point of the box. (Max)
|
\L(1,Max) %(1,@V"Box_Max")
|
| P99
|
The 99% percentile point of the box. (99%)
|
\L(1,P99) %(1,@V"Box_P99")
|
| M
|
The mean percentile point of the box. (Mean)
|
\L(1,M) %(1,@V"Box_M")
|
| P1
|
The 1% percentile point of the box. (1%)
|
\L(1,P1) %(1,@V"Box_P1")
|
| Min
|
The minimum percentile point of the box. (Min)
|
\L(1,Min) %(1,@V"Box_Min")
|
| D
|
The data points of the box. (Data)
|
\L(1,D) %(1,@V"Box_D")
|
| O
|
The outlier of the box. (Outliers)
|
\L(1,O) %(1,@V"Box_O")
|
Point-by-Point Legend
The Point-by-Point Legend generates a legend entry for every plotted data point.
Graphs must meet certain requirements in order to support this specialized legend type. Refer to the plot requirements for details. The Point-by-Point legend is the default legend type for Piper diagrams.
Like other legends, the Point-by-Point legend syntax has a plot symbol component and a text component.
Basic Syntax
\L([LayerIndex.]PlotIndex[,PointIndex]) %([LayerIndex.]PlotIndex[, @option])
The "@options" typically used in Point-by-Point legends are those for worksheet cell access, specifically the @V and @WT options. See Worksheet Cell Access for information.
Legend Text Customization
The legend text is generated by %( ) substitution notation that incorporates dataset metadata stored in the worksheet column. By default, the graph template uses the Auto Legend setting that is saved with the worksheet template. You can override this default construction using the following list of "@options".
Basic Syntax
See discussions of individual legend types above for use of @options variables.
Using the Data Plot Legend common to most 2D and 3D graphs as an example ...
%([LayerIndex.]PlotIndex[Axis] [,@option])
- If symbol color or size is defined by a dataset, then PlotIndex can be replaced with a special syntax that refers to the modifying dataset: for color mapping/indexing use ?R, for size indexing use ?S.
- For example, use %(1S,@LL) will show 1st plot's Size dataset's column's Long name.
- For example, use %(1.2R,@LL) will show 1st layer's 2nd plot's color dataset's column's Long name.
- You can combine multiple @options interspersed with arbitrary text using something like the following syntax:
- %(PlotIndex,@(@option1+@option2+...))
- For example, using the expression %(1,@(@LL(@LU))), will combine Long Name and Units in the form of Long Name(Units).
- Within the inner parentheses you can mix arbitrary text as in:
- %(1X,@(Long Name @LL, Units @LU, Comments @LC))
List of @Options
Below are some frequently used @options for customizing graph legend text. For the complete of all @options, see the List of @Options
Notes:While many of these "@" label options can only apply to workbook data, some of them are applicable to matrix data, as well, for example:
%(1,@W) // returns the matrixbook short name.
|
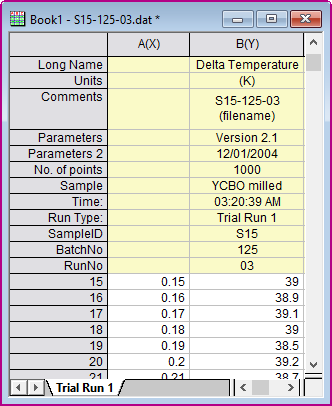
Examples in the following table refer to the above figure:
- Note that system parameters are always named as Parameters, Parameters 2, etc. whereas user-defined parameters can have assigned names such as UserDefined, UserDefined1 or custom names such as No. of points, Sample, etc.
- The plot portion of the syntax can refer to the plot by number (e.g. "1") or using the "?" wildcard which refers to label row cells in the same column as the plot data.
| @option
|
Substitute Text From...
|
Example
|
| @D
|
Dataset name
|
%(1,@D) --> Book1_B
|
| @GF
|
Graph's filter condition.
Support %(L for page title, i.e %(L[n],@GF) where L for current layer and L2 for layer2
|
%(1,@GF) --> > 1996
|
| @GFN
|
Graph's filter condition with column name.
|
%(1,@GFN) --> Year > 1996
|
| @LA
|
Long Name, if available, else Short Name.
|
%(1,@LA) --> Delta Temperature
|
| @LC
|
Comments, if available, else Long Name, otherwise Short Name
|
%(1,@LC) --> S15-125-03 (filename)
|
| @LDn
|
The nth User-defined Parameter. @LD is the same as @LD1. (2025)n=0 for the last user-defined parameter.
|
%(1,@LD2) -->YCBO milled
|
| @LG
|
Long Name (if not available then Short Name) and Units (if present). Equivalent to @U.
|
%(1,@LG) -->Delta Temperature (K)
|
| @LHn
|
The name of the nth User-Defined Parameter row. @LH1 is equivalent to @LH. (2025)n=0 for the last user-defined parameter.
|
%(1,@LH3) -->Time
|
| @LL
|
Column Long Name. Returns missing value if Long Name does not exist.
|
%(1,@LL) --> Delta Temperature
|
| @LM
|
1st line of Comment, if available, else Long Name, otherwise Short Name.
|
%(1,@LM) --> S15-125-03
|
| @LN
|
1st line of Comments (if not available then Long Name, otherwise Short Name) and Units. Equivalent to @(@LM(@LU)).
|
%(1,@LN) --> S15-125-03(K)
|
| @LPn
|
The nth System Parameter. @LP is the same as @LP1.
|
%(1,@LP2) --> 12/01/2004
|
| @LS
|
Column Short Name, equivalent to @C
|
%(1,@LS) --> B
|
| @LU
|
Units
|
%(1,@LU) --> (K)
|
| @LUP,@LUS,@LUA,@LUC
|
add brackets to Units. Parentheses = (), Square brackets = [], Angle brackets = <>, Curly brackets = {}
|
%(1,@LUA) --> <km>
|
| @W
|
Short Name of workbook.
Note: You can use @W, UserVar$ to access the user variable, learn more in Imported File Information Access section below
|
%(1,@W) -->Book1
|
| @WCn
|
The nth line of the WorkBook Comment. If n is not specified, only the first line will be shown.
|
%(1,@WC2) -->
<Origin EXE Folder>\Samples\Curve Fitting
|
| @WL
|
Long Name of workbook
|
%(1,@WL) -->S15-125-03.dat
|
| @WMn
|
The nth line of the WorkSheet Comment. If n is not specified, only the first line will be shown.
|
%(1,@WM) -->Data imported from
|
| @WN
|
The contents of the cell Note.
|
%(1,@WN,1) -->Content of Note in source column of 1st plot, row[1].
|
| @WS
|
Name of the worksheet
|
%(1,@WS) -->Trial Run 1
|
|
Note: When units are displayed in the legend, the English and Japanese versions of Origin enclose the units in parentheses (), while the German version uses square-brackets [].
|
Worksheet Cell Access
There are several special @options for returning worksheet cell content. The @V and @WT options are used mostly for the point-by-point legend:
| @option
|
Substitute Text From...
|
Example
|
| @L, n
|
The X value of the nth point in the data plot.
|
- %(1, @L, 2)
- means the X value of the 2nd data point in the 1st data plot.
|
| @V, n
|
The Y value of the nth point in the data plot.
|
- %(1, @V, 2)
- means the Y value of the 2nd data point in the 1st data plot.
|
| @WT, ColIndex/ColName, RowIndex
|
The worksheet cell value specified by the column index (or short name) and row index.
|
- %(1, @WT, 2, 3)
- means the cell value at column 2, row 3 in the source worksheet of the 1st data plot.
- %(1, @WT, B, 3)
- means the cell value at column B, row 3 in the source worksheet of the 1st data plot.
|
| @WT, ColIndex/ColName, ColLabelRowCharacter
|
The worksheet cell value specified by the column index (or short name) and column label row character.
|
- %(1, @WT, B, C)
- Similar to B[C]$, this will get the Comment from column B, in the source worksheet of the 1st data plot.
|
Adding Symbols Not Used in Plots
As mentioned, the legend entry is composed of a plot symbol component and a text component. Typically, a legend plot symbol is used by one of the data plots in the graph window. However, it may happen that you want to add a legend plot symbol that is not used by any plot in the graph and that is the subject of this section.
Options for Constructing Symbol, Line + Symbol, Line
Beginning with Origin 2018, you can use the legend object's Text tab controls (Properties > Text tab > Add Legend Symbol button) to manually add custom plot symbols of the type used in symbol (scatter), line + symbol and line plots.
Whereas, previously you were required to manually build such symbols using a complex syntax, you can now simply construct plot symbols using the user-interface dialog box. When you do so, you will simultaneously generate the syntax used to construct the symbol. Thus, the user-interface is likely the easiest way to obtain strings for generating custom symbols.
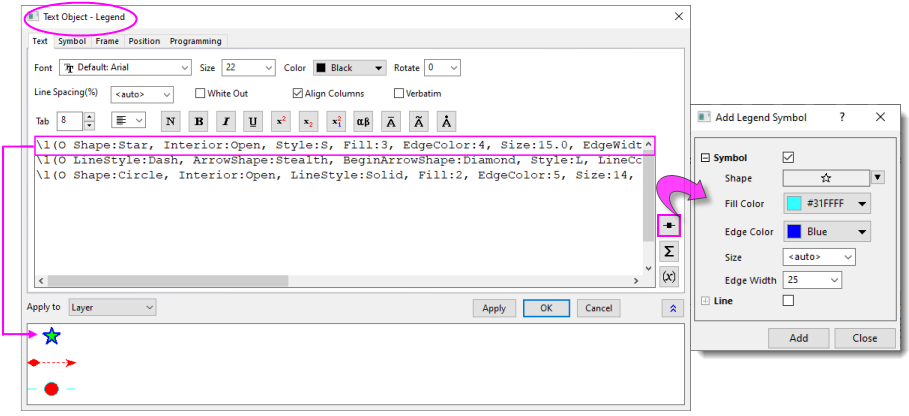
Examples:
Note that properties can be combined in a comma-separated list.
\L(O Shape:Star, Interior:Open, Style:s, Fill:3, EdgeColor:4, Size:15.0, EdgeWidth:20.0)
\L(O LineStyle:Dash, ArrowShape:Stealth, BeginArrowShape:Diamond, Style:L, LineColor:2, ArrowWidth:7.0, ArrowLength:10.0,
     BeginArrowWidth:8.0, BeginArrowLength:12.0)
\L(O Shape:Circle, Interior:Open, LineStyle:Solid, Fill:2, EdgeColor:5, Size:14, EdgeWidth:15.0, LineColor:5, Gap:60)
| Property
|
Options
|
Example
|
| Style
|
Style:<keyword> sets line and/or symbol sequence: s=symbol, l=line segment. Can appear in any order.
|
Style:sls
|
| Gap
|
Gap:## sets the line to symbol gap in point size, Gap:p## displays the gap as a percentage of default (can be > 100%).
|
Gap:24
Gap:p200
|
| Size
|
Size:## sets scatter symbol point size, Size:p## sets percentage of (plot) symbol point size (can be > 100%).
|
Size:18
Size:p200
|
| Shape
|
Shape:<keyword> sets symbol shape: Square, Circle, UpTri, DownTri, Diamond, Plus, Times, Asterisk, HorizontalBar, VerticalBar, Arrow, LeftTri, RightTri, Hexagon, Star, Pentagon, Sphere.
|
Shape:Star
|
| Interior
|
Interior:<keyword> sets symbol interior: Solid, Open, Dot, Hollow, Cross, XLines, HLine, VLine, HalfUp, HalfRight, HalfDown, HalfLeft
|
Interior:Open
|
| Fill
|
Fill:<index> or Fill:<htmlColor> sets the interior color on hollow symbols. Works with LabTalk color index or with HTML color codes.
|
Fill:18
Fill:#FFFFFF
|
| EdgeColor
|
EdgeColor:<index> or EdgeColor:<htmlColor> sets the interior color on solid symbols. Works with LabTalk color index or with HTML color codes.
|
EdgeColor:1
EdgeColor:#000000
|
| EdgeWidth
|
EdgeWidth:## sets symbol edge thickness in point size, EdgeWidth:p##displays the thickness as a percentage of plot symbol edge width (can be > 100%).
|
EdgeWidth:15.0
EdgeWidth:p100
|
| LineStyle
|
LineStyle:<keyword> sets line style: Solid, Dash, Dot, DashDot, DashDotDot, ShortDash, ShortDot, ShortDashDot
|
LineStyle:Solid
|
| LineColor
|
LineColor:<index> or LineColor:<htmlColor> sets line color. Works with LabTalk color index or with HTML color codes.
|
LineColor:1
LineColor:#000000
|
| LineWidth
|
LineWidth:## sets line width in point size, LineWidth:p## displays line width as a percentage of plot line size (can be > 100%).
|
LineWidth:1.5
LineWidth:p100
|
| Length
|
Length:## sets line length in point size, Length:p## displays it as a percentage of width of active dataset indicator (can be > 100%).
|
Length:100
Length:p200
|
| BeginArrowShape
|
BeginArrowShape:<keyword> sets arrowhead shape for the beginning (left-side) of the arrow: Filled, Empty, Stealth, FilledReverse, EmptyReverse, StealthReverse, Stick, Cross, Diamond, Rectangle, Ellipse, StickUp, StickDown
|
BeginArrowShape:Diamond
|
| BeginArrowWidth
|
BeginArrowWidth:## sets arrowhead width in point size for the beginning (left-side) of the arrow.
|
BeginArrowWidth:8.0
|
| BeginArrowLength
|
BeginArrowLength:## sets arrowhead length in point size for the beginning (left-side) of the arrow.
|
BeginArrowLength:12.0
|
| ArrowShape
|
ArrowShape:<keyword> sets arrowhead shape for the ending (right-side) of the arrow: Filled, Empty, Stealth, FilledReverse, EmptyReverse, StealthReverse, Stick, Cross, Diamond, Rectangle, Ellipse, StickUp, StickDown
|
ArrowShape:Diamond
|
| ArrowWidth
|
ArrowWidth:## sets arrowhead width in point size for the ending (right-side) of the arrow.
|
ArrowWidth:8.0
|
| ArrowLength
|
ArrowLength:## sets arrowhead length in point size for the ending (right-side) of the arrow.
|
ArrowLength:12.0
|
Options for Constructing Blocks
The following table explains the syntax used in constructing block-style plot symbols.
There are a couple of important differences with the syntax used for line, line + symbol and line-style plot symbols.
- The \L(O syntax is not supported by this style of plot symbol. Instead the user must use an \L(1, syntax.
- The \L(1, syntax cannot create a symbol without a parent data plot. Whereas with the \L(O syntax, one can add symbols to a legend object in an empty graph window, the \L(1, syntax must begin with an existing data plot of the appropriate type (i.e. a plot which uses a Pattern tab in Plot Details, such as a column plot). Hence, any symbol that you add to the legend is really a modification of an existing plot symbol, not an entirely new one.
- While the \L(O syntax uses a comma-separated list, the \L(1, syntax uses a space-separated list.
Examples:
Note that properties can be combined in a space-separated list.
\L(1, PatternScale:p200 PatternFill:2 BorderStyle:Dash BorderColor:4 BorderThick:2 Width:40 Height:40)
| Property
|
Options
|
Example
|
| Pattern
|
Pattern:## sets pattern by index number, starting from 1.
|
Pattern:5
|
| PatternColor
|
PatternColor:## or PatternColor:<htmlColor> sets the pattern color. Works with LabTalk color index or with HTML color codes.
|
PatternColor:6
PatternColor:#FF00FF
|
| PatternFill
|
PatternFill:## or PatternFill:<htmlColor> sets block interior color. Works with LabTalk color index or with HTML color codes.
|
PatternFill:5
PatternFill:#81F7F3
|
| BorderStyle
|
BorderStyle<keyword> sets border style: Solid, Dash, Dot, DashDot, DashDotDot, ShortDash, ShortDot, ShortDashDot
|
BorderStyle:Dash
|
| BorderColor
|
BorderColor:## or BorderColor:<htmlColor> sets block interior color. Works with LabTalk color index or with HTML color codes.
|
BorderColor:16
BorderColor:#8000FF
|
| BorderThick
|
BorderThick:## sets border thickness as a multiple of default thickness.
|
BorderThick:2
|
| PatternWidth or Width
|
PatternWidth:p## or Width:p## sets block width as percentage of active dataset indicator] (max value = 100%).'
|
PatternWidth:40
|
| PatternHeight or Height
|
Height:p## sets block height as percentage of active dataset indicator (max value = 100%).
|
PatternHeight:20
|
Old Syntax for Adding Symbols Not Used in Plots (v2017 and earlier)
While it requires some patience, you can create a legend symbol with no relationship to plotted data.
The following four kinds of syntax can be used in different occasions, depending on what kind of symbols you would like to use.
| \L(O SymEdgeColor,Sym,Fill,Size,ColorLn,LineStyle,Gap,LnWidth,SymFillColor,EdgeThickness)
|
| \L(S 0, Sym, Fill, SymEdgeColor, SymFillColor, Size, LineStyle, ColorLn, LnWidth, Gap, EdgeThickness)
|
| \L(S 1, SymIndex, SymEdgeColor, Size, , , LineStyle,ColorLn, LnWidth, Gap)
|
| \L(S 1,CharIndex,CharColor,Size,Font,FontStyle,LineStyle,ColorLn, LnWidth, Gap)
|
Note: When using the \L(S ) syntax, defining the first variable as 0 means to use an Origin built-in symbol, and defining it as 1 means to use a user-defined symbol or an ASCII character.
The definition of each variable is listed below:
| Argument
|
Description
|
| SymEdgeColor
|
From Origin Color index: 1...24 (1=Black,2=Red, etc.) or 24...40 if user-defined colors exist.
From HTML hex code: e.g. #ff0000 (do not surround with double-quotes as is required when using with the color() function).
|
| Sym
|
Symbol to use from Origin Shape index (0=no symbol, 1=square, 2=circle, 3=up triangle, 4=down triangle, 5=diamond, 6=cross, 7=cross(x), 8=asterix, 9=hbar, 10=vbar, 11=number, 12=LETTER, 13=letter, 14=right arrow, 15=left triangle, 16=right triangle, 17=hexagon, 18=star, 19=pentagon, and 20=sphere).
|
| Fill
|
Fill to use in symbol from Origin Interior index (0=solid, 1=open, 2=dot center, 3=hollow, 4=plus center, 5=x center, 6= hbar center, 7=vbar center, 8=half up, 9=half right, 10=half down, and 11=half left).
|
| Size
|
Symbol Size in Points.
|
| ColorLn
|
From Origin Color index or from HTML hex code (see SymEdgeColor).
|
| LineStyle
|
Line Style from Origin Line Styles (0=Solid, 1=Dash, 2=Dot, 3=Dash Dot, 4=Dash Dot Dot, 5=Short Dash, 6=Short Dot, 7=Short Dash Dot).
|
| Gap
|
Gap between Symbol and Line in percent of Symbol Size.
|
| LnWidth
|
Line Thickness in Points.
|
| SymFillColor
|
From Origin Color index or from HTML hex code (see SymEdgeColor).
|
| EdgeThickness
|
Symbol Edge Thickness in percent from 0 to 100.
|
| SymIndex
|
The order of the user defined symbol in the User-defined Symbols Grid. Allow integer input from 1 to 31.
|
| CharIndex
|
The ASCII code of the character. Allow integer input from 32 to 255.
|
| CharColor
|
The color index of the ASCII character. (see SymEdgeColor).
|
| Font
|
The index number of a particular font in your font list. To get the index number for a font, run font(fontname)= in the Script Window or Command Window.
|
| Font Style
|
The index number of font style (Underline, Italic, Bold). 0=no style, 1= Underline only, 2=Italic only, 3=Underline+Italic, 4=Bold only, 5=Underline+Bold, 6=Italic+Bold, 7=Underline+Italic+Bold.
|
| When one variable is left as empty, the default value will be used for this variable. The syntax \L(O SymEdgeColor,Sym,Fill,) will use the default value for all variables after Fill.
You can also use these worksheet cell access notations to define one of the variables using a worksheet cell value.
|
A simpler syntax is available to create a Line Legend Symbol.
\L(L Color, Thickness, Style)
| Argument
|
Description
|
| Color
|
Line Color from Origin Color index: 1..24 (1=Black, 2=Red, etc.) or 24..40 if user-defined colors exist.
|
| Thickness
|
Line Thickness in Points.
|
| Style
|
Line Style from Origin Line Styles (0=Solid, 1=Dash, 2=Dot, 3=Dash Dot, 4=Dash Dot Dot, 5=Short Dash, 6=Short Dot, 7=Short Dash Dot).
|
Other Legend Customizations
Special Formatting of Legend Text
You can also customize the text format by escape sequences. Several frequently used examples are provided below:
| Use this syntax...
|
...to format text
|
Example
|
| \+(text)
|
Superscript
|
%(1)\+(2)
|
| \-(text)
|
Subscript
|
%(1)\-(n)
|
| \g(text)
|
Greek Letters
|
\g(m)
|
| \b(text)
|
Bold
|
\b(Important)
|
| \i(text)
|
Italic
|
\i(%(1))
|
| \u(text)
|
Underline
|
\u(%(1X,@L))
|
| \sc
|
One Horizontal space, even for multiple consecutive spaces
|
\b(%(1Y,@LL)\sc%(1Y,@LD3)\sc%(1Y,@LD4)\sc(%(1Y,@LU)))
|
Legend Element Alignment
| Note: The information below may provide more flexibility in aligning legend elements. If you are simply interested in right-aligning legend text, see this FAQ.
|
To specify the alignment properties for symbol and text in legend, you need to activate the graph, and run the script below in Script Window:
legend.align=1; //turn on the alignment mode
Then, you can right click the legend to select Properties to open the dialog, and add \^() as cell anchor, which set alignment for the object on the right side of anchor, \^(l), \^(c), \^(r) are LEFT, CENTER and RIGHT alignment respectively, for example:
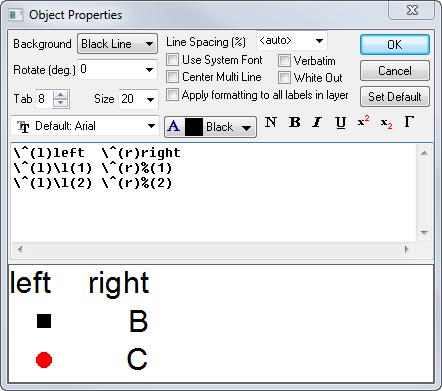
After clicking OK, the legend will be shown the same as the preview in dialog.
Alternatively, you can press Ctrl and drag to re-arrange the legend:
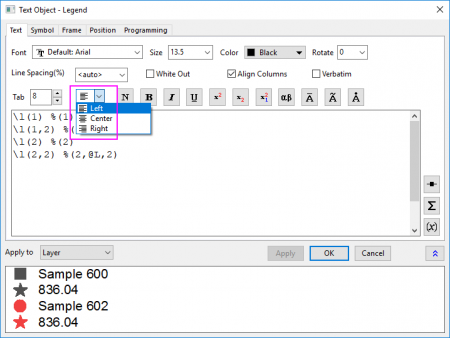
Note: Since Origin 2020b, there is a drop-down list Align Text in Text tab of Text Object -Legend dialog to allow you align the text easily.
|
For instance, you can make a legend object at the right side of current legend row when using Ctrl+drag. In this case, you need to use \^(lu), \^(cc), \^(ru) instead \^(l), \^(c), \^(r) between symbol and text:
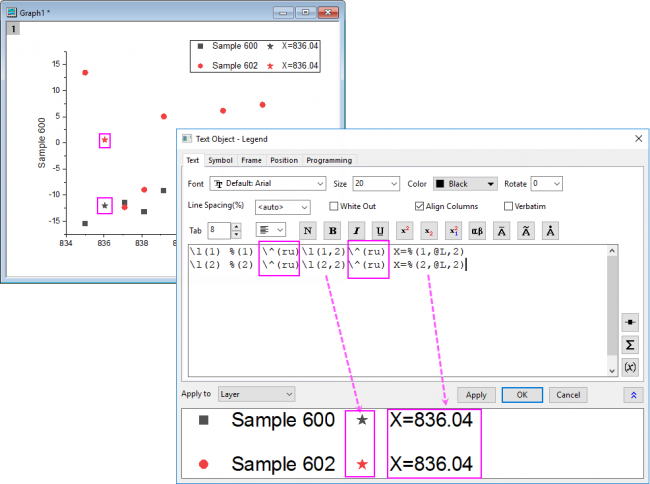
In this way, the legend items of plots and special points will be treated as one group when Ctrl+drag rearranging, as shown below:

Otherwise, the symbols and corresponding texts will be separated when Ctrl+drag rearranging:

|