|
| Featured Customer Story |
|
Ariel Fischer and his team wanted a framework for constructing complex analytical reports that supported easy access to financial models and data from different parts of the organization. They saw the need for a software solution that would seamlessly work together with their data warehouse and MATLAB code, enabling them to fully automate the production of publication quality reports. Using Origin as the front end solution, they were able to create a fully automated reporting tool. This solution has been used to create a credit rating report of 150 Nordic banks.
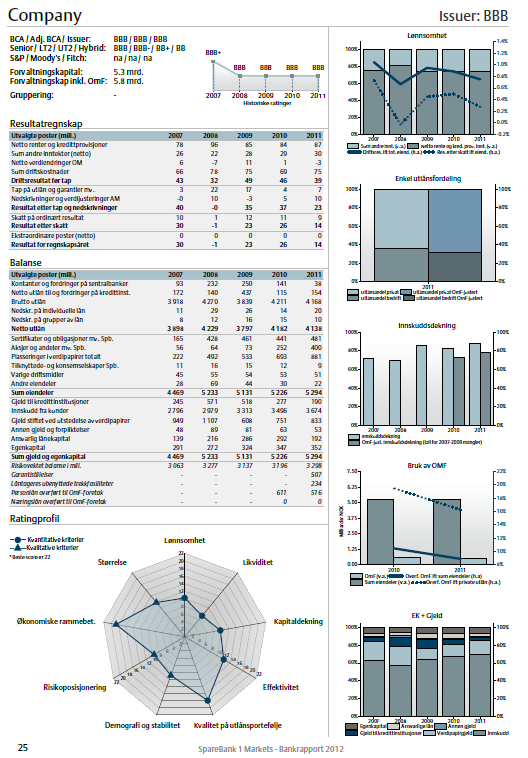
Ariel Fischer says: “The most central Origin feature in this project is the COM-server functionality combined with Origin C and LabTalk, which allows for a seamless integration of Origin with our existing data storage and analysis tools. Additional powerful features of Origin that were utilized include: worksheet queries, animation creation, built-in statistical functions and the import interface. Origin proved to be all-in-all the smoothest way to manage the different elements in the report. The quality of the output is beyond what I have seen in other graphing/analysis-software.”
Read more about it here.
|
|
| Upcoming Events |
|
Tradeshows
OriginLab will be attending these upcoming tradeshows:
APS 2013, Baltimore, MD
Dates: March 19-21, Booth#: 1001
ACS Spring 2013, New Orleans, LA
Dates: April 7-9, Booth#: 1500
Experimental Biology 2013, Boston, MA
Dates: April 20-24, Booth#: 1162
|
|
|
|
| Social Media |
|
Follow us on Twitter, Facebook, LinkedIn, and YouTube for technical updates, and to connect with other Origin users:
|
|
| Tools and Resources |
|
Video Tutorials
Check out our redesigned video tutorials page:
http://originlab.com/Videos
The page also includes playlists. View Origin 9 playlist here.
New File Exchange Tools
We have uploaded two new tools to the File Exchange area of our website:
Tech Tip
Did you know that you can add a vertical or horizontal line to your graph at a specified location using the "Graph->Add Straight Line" menu item in Origin 9? A label is also added, and the label can be further customized.
Graph Gallery
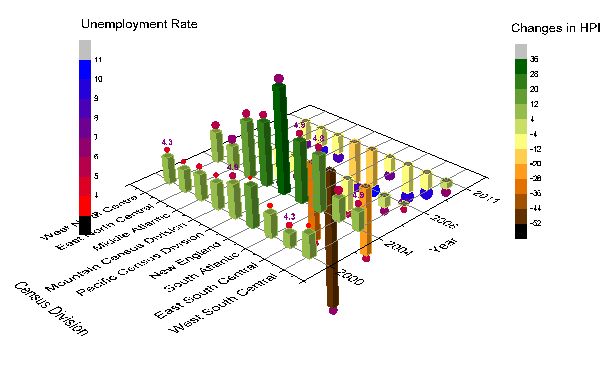
Learn how to combine 3D Bar and 3D Scatter plots in Origin 9, to present multidimensional data with colormapping.
Forum
Get your questions answered, and engage in discussions with other users, on our Forums.
Find more technical resources on our Help Center page.
|
|
| News from You |
|
We want to hear from you.
Share your Origin experiences and graphs with us, and your story could be featured on our website or in the next issue of our newsletter.
Do you have requests for new features?
Send an e-mail to: newsletter@originlab.com.
|
|